
World Innovation
GLOBAL INNOVATION
THINK TANK WORLD INNOVATION Who are we ?
World Innovation Think thanks for human development around the world. Think, Produce and disseminate innovative solutions throughout the world. We support entrepreneurs who want to change the world and we work for inclusive growth. Innovation is important for driving economic progress and competitiveness – both for developed and developing economies. It is essential to place innovation at the center of the inclusive growth strategy. Many governments place innovation at the center of their growth strategies. With this in mind, measuring innovation and providing a rigorous statistical benchmark that attempts to capture national innovation ecosystems is at the heart of the World Innovation team. Our actions
- Research in Global Innovation
- Study on global governance
- Fight against wealth gaps
- Work for a better distribution of wealth in the world
- Optimization of business models
What is WIPO?
- WIPO is the global forum for intellectual property (IP) services, policy, information and cooperation.
- It is a self-funding agency of the United Nations, with 193 member states.
- Its aim is to lead the development of a balanced and effective international IP system that enables innovation and creativity for the benefit of all.
- Its mandate, governing bodies and procedures are set out in the WIPO Convention, which established WIPO in 1967.
Think-Thank Foundation Is Working In Following Areas:-


Strategies for Global Innovation Management
1. Creating conversations
2. Pulling employees
3. Run awareness campaigns
4. Introducing a common space
5. Transparency
Importance of Global Innovation Management
When organizations around the world build a culture of innovation, it drives sustainable and productive practices that spark more ideas. These ideas work wonders in workspaces or organizations to stay ahead and remain competitive in the long haul.
Pooling innovation helps produce new products and services, enhance an organization’s success, improve the development process, and introduce cost-reducing techniques. This sums up the importance of global innovation management across organizations.

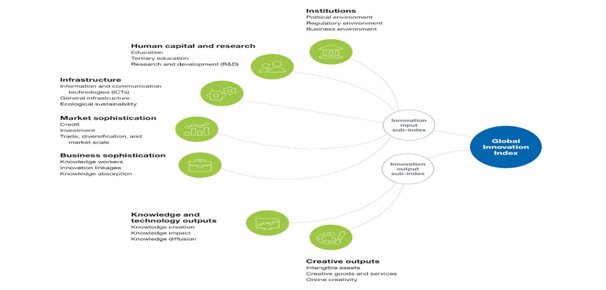
How is the Global Innovation Index calculated?
The GII is calculated by taking a simple average of the scores in two sub-indices. The sub-indices are:
- Innovation Input Index (composed of five pillars)
- Innovation Output Index (composed of two pillars)
Both the pillars describe an attribute of innovation each and contain up to five indicators. Their score is computed by the weighted average method.
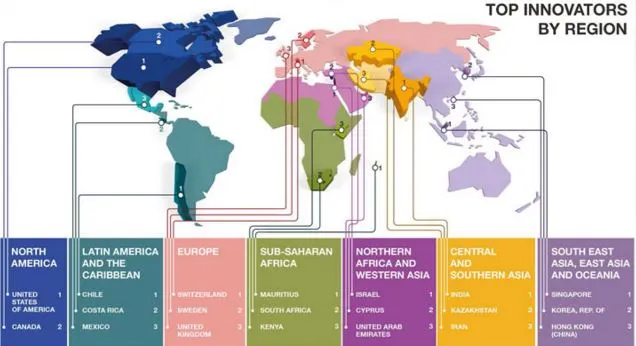
GII and India
As seen from the table above, India is the top country in its group, which is Central and Southern Asia.
- India is ranked 40th, six places above the previous year’s rank.
- This is for the first time that India is ranked within 40th in the GII.
- India is now the first innovative lower-middle-income economy in the world.
- India ranks in the top 15 in the following indicators:
- Government online services
- ICT services export
- Graduates in science and engineering
- R&D-intensive global companies
- The report states that India has the highest innovation quality among lower-middle-income countries.
- The consistent improvement in the index rankings is owing to the immense knowledge capital, the vibrant startup ecosystem, and the amazing work done by the public and private research organizations.
- India improved the most in three pillars: Institutions (61st), business sophistication (55th), and creative outputs (64th).
- The India Innovation Index 2019 which was released by the National Institution for Transforming India NITI Aayog, has been widely accepted as the major step in the direction of decentralization of innovation across all the states of India.
The state of global innovation

Figure 1
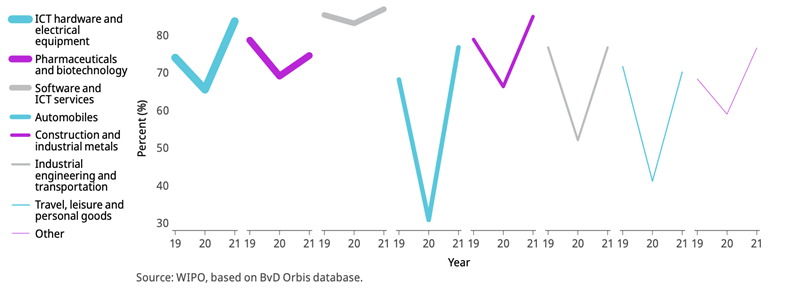
Figure 2
GII 2022 shows that research and development (R&D) and other investments, which drive innovation, continued to surge in 2021 despite the COVID-19 pandemic.
Technology firms are at the core of GDP contributions for most developed and developing nations. They are now – and will continue to be – essential to the global economy. As a result, governments will continue to rely on innovation by technology firms, for future economic growth, and venture firms will continue to invest in technology firms with high growth potential, contributing capital to those jurisdictions that best support such innovation.
However, these figures mask large differences at the industry level. Figure 1 presents annual R&D expenditures, revenues and R&D intensities for the seven industries with the greatest cumulative R&D investment in 2021. Similar to last year, the increase in R&D expenditures between 2018 and 2021 is primarily driven by four industries, ICT hardware and electrical equipment; pharmaceuticals and biotechnology; software and ICT services; and construction and industrial metals.
What determines the rankings?
GII rankings are based on the following seven pillars, split into the following Innovation Input and Output Indexes. The economies are then scored based on the overall aggregated associated scores on each of them:
Innovation Inputs:
- Institutions/ Filmographic details
- Human and Capital Research
- Infrastructure
- Market Sophistication
- Business Sophistication
Innovation Outputs:
- Knowledge and Technology Outputs
- Creative Outputs
- Technology Clusters
About the Global Innovation Index–GII:
- It is published by by the World Intellectual Property Organization (WIPO), in partnership with the Portulans Institute and with the support of its corporate partners including the Confederation of Indian Industry (CII), the Brazilian National Confederation of Industry (CNI), Ecopetrol (Colombia), and the Turkish Exporters Assembly (TIM).
- The GII aims to capture the multi-dimensional facets of innovation ranking and rich analysis referencing around 132 economies.
- Indicators: The index ranks world economies according to their innovation capabilities and consists of roughly 80 indicators grouped into innovation inputs and outputs.
Highlights of the Global Innovation Index 2022
- India has leapfrogged to 40th position on the Global Innovation Index (GII) 2022 from the 81st spot in 2015. The country was ranked 46th on the index last year.
- Switzerland is the most innovative economy in the world in 2022 – for the 12 th year in a row – followed by the United States, Sweden, the United Kingdom and the Netherlands.
- China is nearing the top 10 while Türkiye and India enter the top 40 for the first time, according to the GII 2022.
- According to the report, India continues to lead the world in ICT services exports, ranking first, while also ranking first in other indicators such as Venture capital recipients’ value (6th), Domestic industry diversification (14th).
- Graduates in science and engineering (11th), Labor productivity growth (12th), and Finance for startups and scaleups (8th)
- The GII report also said research and development (R&D) and other investments that drive worldwide innovative activity continued to boom in 2021 despite the Covid-19 pandemic, but challenges are emerging in translating innovation investments into impact.
What is the future of innovation-driven growth?
Ministers and Heads of States made special addresses at the launch event, while investors, business leaders, renowned scientists and academics, and representatives from prominent organizations participated in two panel discussions.
Problem with the Global Innovation Index
INSEAD Business School, along with Cornell University and the World Intellectual Property Organisation have just released their analysis of the world’s most innovative countries for 2016.
Together, this is called the Global Innovation Index and aims to objectively measure several dozen indicators to assess which countries are comparatively more innovative than others.
You may have seen graphics being forwarded around Linkedin, with a chart displaying the top rankings of “most innovative countries 2016” next to a cross-section of random index numbers, declaring that once again Switzerland is the most innovative country in the world.
First of all, I want to congratulate these institutions and the hundreds of collaborators who work on not only the report, but also compiling the thousands of data points to make the comparative analysis possible.
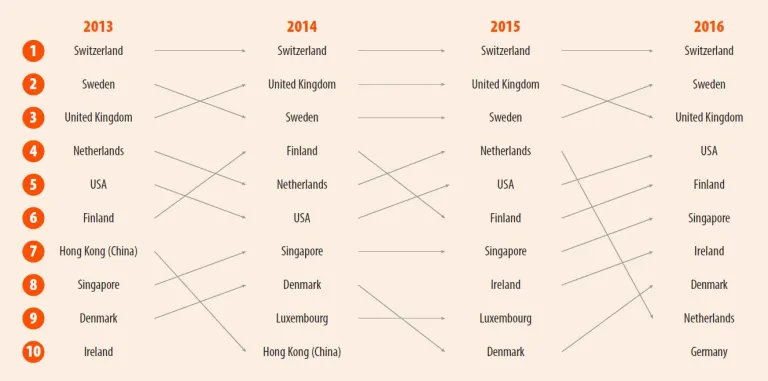
For innovation professionals like myself, this data trove is a goldmine for uncovering trends which are happening across the world, especially as you can compare current data to previous years to find both local and global trends. The full report (which you can download for free at the above link) is over 451 pages long and has a substantial level of detail, for each country and also each index they use to form the total. Here you can see how the top 10 countries’ positions have changed over the past 4 years, and how Switzerland has remained steady at the top.
The analysis itself is also often top-notch, with top economists sifting through both the micro-economic and macro-economic data to find the underlying trends. For example, the trend for the 2016 report was “Winning with Global Innovation”, and it showed how R&D is becoming more open and geographically diverse.
However, as you may have guessed from the title, I have one major concern with the foundation of the index which results in me taking its findings (like all other reports I analyse) with a grain of salt:
“In order to stay unbiased and objective in producing this index, the analysts rely on a series of available numerical datasets available to compare countries. This limited availability means that the analysts need to choose which ones represent the “innovativeness” of a country, and it is here that in my opinion the analysts have put too much emphasis on macroeconomic and socio-political data-points, and too little on data points which actually relate to achieveing innovation.”
The problem with extrapolating data
I spent 8 years as a management consultant, and a number of my projects were referred to as “Strategy Consulting”. Here, we would be asked to make predictions for a specific topic, such as the likely growth rates for an industry segment based on trends.
In order to make such an assessment, you need two primary things:
- Baseline and historical data points to identify what the data is telling you (e.g. comparative benchmarks, industry analysis)
- Insight into what the data is telling you, and how external future forces and current trends may affect the industry (scenarios such as disruptive new technology, price drops or changes in consumer behaviour)
The issue arises in that part 1 is quite impartial, unbiased and objective, as it is primarily numerical and based on current available data. However, part 2 is where humans like me get their grubby hands on these numbers and start using intelligence and insight to create future “scenarios” which may or may not be true. These scenarios are therefore more subjective, and will vary based on the people who provided the insight, and the thought processes and intelligence of those people. This is why consultants are paid so much. The more evidence that is available to back up the insights, the lower the risk that they could be wrong, but they will never be 100% guaranteed.
- Innovation Inputs
- Institutions
- Human Capital and Research
- Infrastructure
- Market Sophistication
- Business Sophistication
- Innovation Outputs
- Knowledge and Technology Outputs
- Creative Outputs